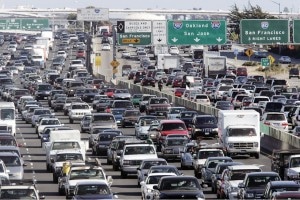
Cheap gas, an improving economy and a bunch of new cars, trucks and utility vehicles sold all add up to one thing: Americans are driving. In fact, they’re driving at a record pace through the first half of 2016, according to the latest figures.
Vehicle miles traveled (VMT) for the first six months of 2016 hit 1.58 trillion million miles through June, according to the Federal Highway Administration’s (FHWA) most recent Traffic Volume Trends report. The previous record of 1.54 trillion miles was set last year.

FHWA says for comparison, 1.58 trillion miles, which is a 3.3% increase over last year, equates to roughly 250 round trips from Earth to Pluto.
For June, VMT in the U.S. reached 282.3 billion miles, a small increase over the same month in 2015. The seasonally adjusted figure, which the Bureau of Transportation Statistics (BTS) uses to “even out seasonal variation in travel” for comparison purposes, was 268.1 billion miles. This was an increase of 2.9% compared to June last year.
(Death toll on U.S. roads continues to rise. For more, Click Here.)
While it’s not all that surprising we’re driving more, the next question is who is leading the way? Well, it’s the wild, wild West, according to the bureau. Of the five regions, the 13-state West was up 4.1% for the first half of the year.
The leader in the West was Hawaiian drivers. They were up 8.6% on a year-over-year basis with Idaho and Utah tied for second at 5.1%. The only decrease was seen in North Dakota, with a 2.4% drop.
While we are rolling up more miles than ever, are individual drivers racking them up at a higher rate, Bloomberg News says no. Since the U.S. population continues to set new records for growth, it would follow that there are more drivers on the road than ever.
In short, it would only make sense that country is rolling up more miles on its highways and byways, the news site notes. However, a better number to gauge are Americans driving more is U.S. vehicle miles traveled per person.
(Click Here to learn how to keep your vehicle from becoming a theft statistic.)
The average American drives 12,545.5 miles annually as of June 1, according to the Bureau of Labor Statistics. An uptick compared to last year’s June 1 figure of 12,279.4 miles annually. However, quite a bit less than the 13,222 miles averaged on June 1, 2005: the highest number since bureau began tracking the number in 1992.
As a nation, we may be driving less as individuals but because there are more cars on the roads, we’re tallying up more miles. We’re also tallying up more crashes. The death toll on American roads and highways continues to rise as new estimates show a 9% jump in motor vehicle deaths through the first six months of 2016, according the National Safety Council.
An estimated 19,100 people have been killed and 2.2 million seriously injured compared with the same period in 2015. The figure is 18% higher than 2014 results. The deaths not only extract a toll on the impacted families, but the estimated financial cost is $205 billion.
(To find out more about Canadian auto workers approving a strike means, Click Here.)
The upward trend began in late 2014 and despite the introduction of stronger, safer vehicles laden with more safety technology than ever, it appears to show no sign of decreasing. Last winter, the NSC issued its largest year-over-year percentage increase in 50 years, when it estimated fatalities had jumped 8% in 2015 compared to 2014.


WE need to realize that the drop in deaths after 2007 was ECONOMIC! Just like the 2015 increase is ECONOMIC!
You don’t get a almost 10K drop due to some program. That was a RECESSION DROP!
http://www-fars.nhtsa.dot.gov/Main/index.aspx
The 2007 US deaths were 41,259 which was at the time the biggest driving year till 2015.
It is really important to NOT compare 2015 to the recession years as any comparison to 2008 to 2014 numbers SKEW the results due the recession affecting the numbers.
Here are 2006 thur 2014.
http://www-fars.nhtsa.dot.gov/Main/index.aspx
2006 US Death rate per mile 1.42 Total Deaths 42,708 Miles Driven 3.014 Trillion (3,014 VMT Billion)
2007 US Death rate per mile 1.36 Total Deaths 41,259 Miles Driven 3.031 Trillion
Recession Begins
2008 US Death rate per mile 1.26 Total deaths 37,423. Miles Driven 2.977 Trillion (2,977 VMT Billion)
2009 US Death rate per mile 1.15 Total deaths 33,883. Miles Driven 2.957 Trillion
2010 US Death rate per mile 1.11 Total deaths 32,999. Miles Driven 2.967 Trillion
2011 US Death rate per mile 1.10 Total deaths 32,479. Miles Driven 2.950 Trillion
2012 US Death rate per mile 1.14 Total deaths 33,782. Miles Driven 2.969 Trillion
2013 US Death rate per mile 1.10 Total deaths 32,894. Miles Driven 2,988 Trillion
2014 US Death rate per mile 1.08 Total deaths 32,675. Miles Driven 3.026 Trillion (3,026 VMT Billion)
The cause is driving miles increasing with more DUI, younger drivers, and more discretionary driving.
Also Why isn’t NHTSA mentioning the DR per mile! It was 1.12 for 2015, was lower than 2012 which was 1.14!
http://www.motorists.org
Note: the death rate you cite is deaths per 100 million miles — not deaths per mile.
I can see the government sitting on the edge of their seat waiting to suggest a dollar a gallon “safety surtax” to raise the price of gasoline, thereby reducing the number of miles people will be able to afford to drive every year and thus saving thousands of lives! Don’t laugh….
I would suggest that instead we simply hand out more tickets for failure to use turn signals and distracted driving. Drive down any highway, and the number of people you see driving while texting is staggering! And, turn signals? I know they are just a primitive signaling device, but I never got the email that said we don’t need to use them anymore. Or perhaps I was just not paying attention?